tl;dr One of my graduating students (Benjamin D. Kim) will be presenting a chapter of his M.S. thesis he completed at the University of Illinois at Urbana-Champaign (UIUC)! This work, on DP Rényi auditing, will appear at the TPDP 2026 workshop (and again at an ICML workshop this summer). Ben begins his Ph.D. at MIT EECS in the fall. Wishing him the best of luck as he begins a new journey. Here is the arxiv posting of the paper.
Differential privacy has become one of the dominant frameworks for protecting sensitive information in machine learning. In its ideal form, a differentially private algorithm guarantees that the presence or absence of any single person’s data has only a limited effect on the distribution of outputs. This is a powerful promise: even if an adversary sees the trained model, the released statistics, or some downstream prediction, they should not be able to infer too much about any one individual in the training set.
But as differentially private machine learning systems move from theory into practice, a natural question arises:
How do we know that a system claiming differential privacy is actually private?
That question is the starting point of our paper. The paper develops a black-box auditing framework for machine learning algorithms that claim Rényi differential privacy (RDP). The key idea is to treat privacy auditing as a statistical estimation problem: run the mechanism on neighboring datasets, observe its outputs, and estimate the Rényi divergence between the resulting output distributions. The paper’s main technical contribution is to do this using the Donsker–Varadhan variational representation of Rényi divergence, implemented with neural estimators inspired by MINE, and to prove finite-sample confidence guarantees and matching minimax lower bounds.
The paper contributes to the literature (e.g., see [3], [4], [5]) that moves privacy auditing closer to the role that cryptanalysis plays in cryptography: a necessary discipline for stress-testing, validating, and understanding the real security of deployed systems.
Why differential privacy needs auditing
A differential privacy guarantee is a theorem/lemma about a (randomized) mechanism. If an algorithm is correctly implemented, if the analysis is tight, if the accounting is correct, if the randomness is generated properly, and if all modeling assumptions are satisfied, then the promised privacy parameter should hold.
That is a lot of “ifs.”
In modern private machine learning, the most common algorithmic workhorse is DP-SGD: differentially private stochastic gradient descent. DP-SGD clips per-example gradients, adds Gaussian noise, and composes privacy loss over many training steps. In practice, privacy accounting is often expressed using Rényi differential privacy because RDP composes cleanly and is central to modern privacy accountants. The paper emphasizes that DP-SGD and related private learning systems are routinely deployed with RDP guarantees because of these tight composition properties.
However, the existence of a theoretical privacy analysis does not eliminate the need for empirical validation. Auditing matters for at least four reasons.
First, implementations can be wrong. Gradient clipping may be misapplied, random seeds may be mishandled, batching may differ from the analyzed model, or the privacy accountant may be used incorrectly. A privacy theorem protects the algorithm as specified, not necessarily the code that is actually deployed.
Second, privacy analyses can be loose. An algorithm may satisfy a formal upper bound, but the true privacy leakage may be much smaller or, in some cases, larger than expected under a flawed analysis. Auditing gives empirical lower bounds on the true leakage and helps assess whether the accounting is informative.
Third, privacy claims need external validation. In deployed systems, users, regulators, and scientific reviewers may not be satisfied with a claimed value of  . They may want evidence that the implementation behaves as advertised.
Fourth, auditing can reveal the operational meaning of privacy parameters. Even when a theoretical guarantee is correct, it may be difficult to interpret. Empirical attacks and audits help translate abstract divergence bounds into observable distinguishability.
This is why our paper frames privacy auditing as the counterpart to privacy accounting. Privacy accounting gives an upper bound: “the mechanism should leak at most this much.” Privacy auditing gives a lower bound: “we can empirically demonstrate at least this much leakage.” A good auditing method narrows the gap between these two quantities.
DP auditing as cryptanalysis for private machine learning
A useful analogy is with cryptography.
In cryptography, a proposed encryption scheme, signature scheme, or zero-knowledge protocol is not considered trustworthy merely because its designers believe it is secure. The community tries to break it. Cryptanalysts look for distinguishing attacks, key-recovery attacks, side-channel attacks, malleability attacks, and implementation vulnerabilities. A failed attack does not prove security, but strong cryptanalysis increases confidence; a successful attack exposes a gap between the claimed security and the actual behavior.
DP auditing plays a similar role for privacy-preserving machine learning.
A claimed DP mechanism is like a cryptographic construction. Its privacy proof is like a security reduction or theorem. An audit is like an attack: the auditor tries to distinguish whether a specific individual’s data was included in training. If the auditor can distinguish the “in” world from the “out” world too well, then the mechanism leaks more information than expected.
The analogy is especially clear in membership-inference audits. The attacker constructs two neighboring datasets: one containing a special record, often called a canary, and one without it. The mechanism is run many times on both datasets. The auditor then observes the outputs and tries to distinguish which dataset was used. If the output distributions are far apart, the canary has left a detectable trace.
But there is also an important difference between cryptanalysis and DP auditing. In cryptography, the usual goal is to find any efficient adversary that violates a security definition. In DP auditing, especially in this paper, the goal is more quantitative: estimate a divergence between distributions and attach a statistically valid confidence statement to that estimate. The auditor is not merely saying “I found an attack.” The auditor is saying something closer to:
With high confidence, the Rényi divergence between the mechanism’s outputs on these neighboring datasets is at least this value.
That makes the audit directly comparable to an RDP claim. This is one of the central conceptual advances of the paper. Rather than auditing DP indirectly through a particular attack heuristic, the paper audits the same mathematical object that appears in the privacy definition: the Rényi divergence between neighboring output distributions.
From DP to Rényi DP
Pure/approximate differential privacy says that a randomized mechanism  is
is  -DP if, for all neighboring datasets
  and all measurable events
  ,
,
![Pr[M(D)\in S]\leq e^\varepsilon Pr[M(D')\in S]+\delta.](https://s0.wp.com/latex.php?latex=Pr%5BM%28D%29%5Cin+S%5D%5Cleq+e%5E%5Cvarepsilon+Pr%5BM%28D%27%29%5Cin+S%5D%2B%5Cdelta.&bg=ffffff&fg=4c4c4c&s=0&c=20201002)
Rényi differential privacy instead bounds the Rényi divergence between the output distributions:

for a Rényi order  . In our paper, we recall this definition and notes that RDP can be converted back into approximate DP using the standard conversion: if a mechanism satisfies
  -RDP, then it also satisfies
  -DP.
-DP.
RDP is particularly useful for machine learning because privacy loss accumulates over many iterations of training. DP-SGD may run for hundreds or thousands of steps. RDP gives a convenient and often tight way to account for this composition. That is why modern DP-SGD analyses often report privacy through an RDP accountant, even if the final result is converted into -DP. But this creates a mismatch in the auditing literature. Many prior audits were designed around pure or approximate DP, membership inference, data poisoning, or hypothesis testing formulations. These are valuable, but they do not directly estimate the RDP quantity that modern privacy accountants actually track. The paper argues that this is a gap: if deployed systems claim RDP guarantees, then auditors should be able to audit RDP directly.
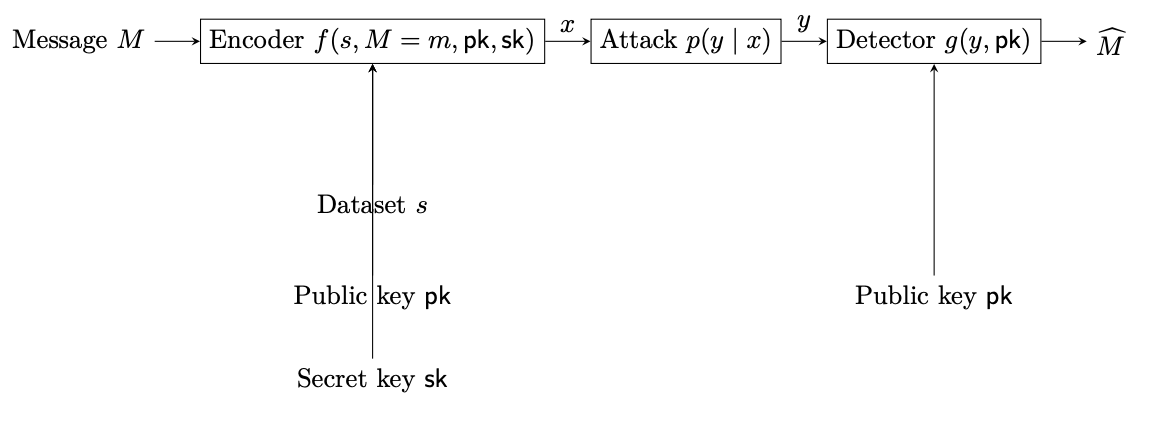
The black-box auditing setting
The paper focuses on black-box auditing. In this setting, the auditor does not inspect the internal gradients, random noise, or intermediate training trajectory. Instead, the auditor can choose inputs, run the training mechanism, and observe outputs or post-processed outputs.
For DP-SGD, the black-box audit proceeds roughly as follows: The auditor chooses a canary example  . The mechanism is trained repeatedly on a dataset
  without the canary and on the neighboring dataset
  with the canary. After training, the auditor measures the loss of the trained model on the canary. This produces two empirical distributions of losses: one from canary-absent training and one from canary-present training. The audit then estimates the Rényi divergence between these two loss distributions. This is a natural black-box attack because if the model behaves differently on the canary depending on whether it was included in training, then the canary has influenced the learned model. In privacy terms, the output distributions
  and
and  are distinguishable.
The paper also uses a technique from prior work: worst-case initialization [3]. DP-SGD’s privacy guarantee is unaffected by the choice of initial parameters before private training, so the auditor can choose initial parameters that make training more sensitive to the canary. The paper follows the method of crafting such initializations by pretraining on a separate part of the dataset. This increases the statistical power of the audit while remaining within a black-box threat model. Again, this is analogous to cryptanalysis: a cryptanalyst often chooses adversarial plaintexts, messages, or protocol inputs to expose weaknesses. Here, the privacy auditor chooses a canary and initialization that make the privacy loss easier to detect.
Why estimating Rényi divergence is hard
The central statistical problem is this:
Given samples from two unknown distributions  and
and  , estimate or lower bound
  .
.
This is challenging because the distributions may be high-dimensional, implicit, and accessible only through samples. In machine learning, the output distribution of a randomized training algorithm may be a distribution over model parameters, predictions, losses, or other post-processed statistics. The density ratio  is not available. Direct plug-in estimation is usually impossible.
This is where variational representations become useful.
A variational representation rewrites a divergence as a supremum over functions. Instead of needing the density ratio explicitly, one searches over a class of critic functions (denoted by  in our work) that try to distinguish samples from and . If the critic class is rich enough, optimizing the variational objective recovers the divergence. If the critic class is restricted, the objective gives a lower bound. This leads to the philosophy behind neural divergence estimation: train a neural network critic to maximize a divergence objective.
The Donsker-Varadhan Representation
The Donsker-Varadhan variational formula [1][2] is a result that expresses certain information-theoretic quantities, most famously KL divergence, as a supremum over test functions. Our paper uses a Rényi-divergence analogue of this variational perspective.
The key insight is that the unknown density ratio is replaced by an optimization problem over functions. In practice, the auditor restricts to a neural network class. The resulting class-restricted objective is a lower bound on the full variational divergence, because the supremum is taken over a restricted class.
For auditing, this lower-bound property is a feature, not a bug. A privacy audit should be conservative. If the neural critic certifies a large lower bound on Rényi divergence, then the true divergence is at least that large, subject to statistical confidence corrections. Optimization failure may make the bound smaller, but it does not create a false privacy violation if the statistical certificate is valid.
MINE and neural estimation of information leakage
MINE (Mutual Information Neural Estimation) [6], popularized the use of neural networks to estimate information-theoretic quantities through variational objectives. In MINE, a neural critic is trained to distinguish samples from a joint distribution from samples from the product of marginals, thereby estimating mutual information.
Our paper relies on this neural-estimation technique for privacy auditing. Instead of estimating mutual information, the auditor estimates a variational Rényi divergence between two loss distributions: the distribution obtained when the canary is absent and the distribution obtained when the canary is present.
There are two important implementation details.
First, the objective involves exponentials of the critic output. This can create high variance, especially for larger Rényi orders  . Second, the expectations in the objective must be approximated using minibatches. Naive minibatch estimates can be unstable because exponential moments are sensitive to outliers. To address this, the paper follows the MINE approach of using minibatching together with an exponential moving average, or EMA. EMA stabilizes the stochastic gradients by smoothing estimates of the exponential terms across minibatches. The paper explicitly notes that this is especially helpful for larger Rényi orders, although variants of this estimator can still have high mean-squared error at larger . For this reason, the experiments focus on
 ![\alpha\in(1,2]](https://s0.wp.com/latex.php?latex=%5Calpha%5Cin%281%2C2%5D&bg=ffffff&fg=4c4c4c&s=0&c=20201002) , where the estimator is more reliable.
, where the estimator is more reliable.
How this improves on previous DP auditing work
Earlier DP auditing work used data poisoning attacks to audit DP-SGD and showed that empirical lower bounds on privacy parameters could exceed naive theoretical analysis. Later work improved the tightness of audits, reduced the number of required training runs, or adapted to different threat models. Some white-box audits exploit knowledge of the DP mechanism and access to intermediate information, while more recent work has explored one-run auditing through connections between DP and generalization. (Our paper’s improvement is not simply that it gets better empirical numbers, although it often does. The deeper improvement is that it changes the object being audited.)
Prior methods often focus on pure or approximate DP, membership inference, data poisoning, or attack-specific distinguishers. These are powerful but indirect for systems whose guarantees are expressed through RDP. This paper directly audits Rényi divergence, the quantity appearing in the RDP definition.
Other works (based on DP violation detection and DP-Finder methods), search for counterexamples or privacy violations. These tools are useful for debugging and falsifying incorrect implementations. But the paper argues that they are not designed to provide tight, sample-valid confidence bounds for correct algorithms, nor do they address RDP auditing with optimality guarantees.
The paper’s contribution can therefore be summarized in three improvements:
- Directness: it audits RDP by estimating Rényi divergence, rather than auditing another privacy notion and converting indirectly.
- Statistical validity: it gives explicit non-asymptotic confidence intervals, separating estimation error from true algorithmic privacy leakage.
- Optimality: it proves minimax lower bounds showing that the sample-complexity guarantees are essentially optimal up to logarithmic factors.
This combination is what makes the result more than another empirical attack. We establish a statistical theory of black-box RDP auditing.
Experimental findings
The empirical section evaluates the auditing method on DP-SGD for image classification tasks, including MNIST and CIFAR-10. The auditor collects 500 loss observations for each canary-in and canary-out condition, then estimates Rényi divergence using the DV-Rényi model. The experiments compare the resulting black-box RDP audits against a prior state-of-the-art black-box auditing method, with conversions among  -GDP, -DP, and RDP where needed. The results show strong gains at small and moderate Rényi orders, especially
  and
and  . For example, at , the DV-Rényi auditor improves over the prior black-box baseline across the reported MNIST and CIFAR-10 privacy regimes. At , the method also improves in many low and moderate privacy regimes, though the results show that performance can degrade at larger target privacy levels, consistent with the known instability of exponential-moment estimators at larger orders or larger divergences.
Our discussion emphasizes that these improvements come from directly auditing Rényi divergence rather than relying on indirect privacy conversions or attack-specific heuristics. The use of worst-case initialization increases the canary’s influence on training dynamics while preserving the validity of the DP-SGD privacy guarantee. The empirical story is therefore aligned with the theory: the auditor is powerful because it estimates the right quantity. (And it is principled because the estimate comes with finite-sample guarantees.)
Open questions
Our paper closes by mentioning several future directions, including extending optimal Rényi auditing guarantees to interactive and distributed settings, and exploring alternative variational formulas with lower variance for larger .
Ben has already started thinking about some of these directions, especially this one:
Can we apply our techniques to audit distributed and federated private learning?
Our focuses on black-box auditing of DP-SGD in a centralized setting. But many privacy-sensitive systems are distributed: federated learning, secure aggregation, data markets, collaborative analytics, and multi-party training. In such systems, privacy leakage may arise not only from the final model but also from messages, participation patterns, aggregation protocols, or side information. Extending optimal RDP auditing to distributed and interactive mechanisms would significantly broaden the applicability of the framework.
References
[1] Monroe Donsker and S. R. Srinivasa Varadhan. Asymptotic evaluation of certain markov
process expectations for large time, IV. Communications on Pure and Applied Mathematics,
36(2):183–212, 1983.
[2] Venkat Anantharam. A variational characterization of rényi divergences. IEEE Transactions on
Information Theory, 64(11):6979–6989, 2018.
[3] Meenatchi Sundaram Muthu Selva Annamalai and Emiliano De Cristofaro. Nearly tight
black-box auditing of differentially private machine learning. Advances in Neural Information
Processing Systems, 37:131482–131502, 2024.
[4] Milad Nasr, Jamie Hayes, Thomas Steinke, Borja Balle, Florian Tramèr, Matthew Jagielski,
Nicholas Carlini, and Andreas Terzis. Tight auditing of differentially private machine learning.
In 32nd USENIX Security Symposium (USENIX Security 23), pages 1631–1648, 2023.
[5] Thomas Steinke, Milad Nasr, and Matthew Jagielski. Privacy auditing with one (1) training run.
In Advances in Neural Information Processing Systems (NeurIPS), volume 36, 2023.
[6] Mohamed Ishmael Belghazi, Aristide Baratin, Sai Rajeswar, Sherjil Ozair, Yoshua Bengio,
Aaron Courville, and Devon Hjelm. Mutual information neural estimation. In Proceedings of
the 35th International Conference on Machine Learning (ICML). PMLR, 2018


![\Pr_{X\sim P}[\phi(X)=1] - \Pr_{X\sim Q}[\phi(X)=1]](https://s0.wp.com/latex.php?latex=%5CPr_%7BX%5Csim+P%7D%5B%5Cphi%28X%29%3D1%5D+-+%5CPr_%7BX%5Csim+Q%7D%5B%5Cphi%28X%29%3D1%5D&bg=ffffff&fg=4c4c4c&s=0&c=20201002)
![\mathbb E_P[\phi(X)]-\mathbb E_Q[\phi(X)] = \sum_x \phi(x)(P(x)-Q(x)).](https://s0.wp.com/latex.php?latex=%5Cmathbb+E_P%5B%5Cphi%28X%29%5D-%5Cmathbb+E_Q%5B%5Cphi%28X%29%5D+%3D+%5Csum_x+%5Cphi%28x%29%28P%28x%29-Q%28x%29%29.&bg=ffffff&fg=4c4c4c&s=0&c=20201002)


![\sup_\phi \left| \Pr_{P}[\phi(X)=1]-\Pr_Q[\phi(X)=1]\right| = d_{\mathrm{TV}}(P,Q).](https://s0.wp.com/latex.php?latex=%5Csup_%5Cphi+%5Cleft%7C+%5CPr_%7BP%7D%5B%5Cphi%28X%29%3D1%5D-%5CPr_Q%5B%5Cphi%28X%29%3D1%5D%5Cright%7C+%3D+d_%7B%5Cmathrm%7BTV%7D%7D%28P%2CQ%29.&bg=ffffff&fg=4c4c4c&s=0&c=20201002)
